NTRIP-Analyser
Analyses NTRIP RTCM 3.x streams from GNSS base stations, and answers whether a station is fit to serve RTK.
ntrip-monitord — the NTRIP monitoring service
ntrip-monitord watches one or more NTRIP mountpoints continuously and
publishes per-mountpoint statistics snapshots that a Munin plugin turns
into graphs: throughput, frame integrity, message rates, satellites,
C/N0 and availability. It is the tool for the question the interactive
applications cannot answer: was this stream healthy last night?
Everything here was exercised on a production deployment (Ubuntu 24.04, munin-node 2.0); the pitfalls documented below were hit for real.
How it works
ntrip-monitord ── holds one persistent session per mountpoint
      │
      │  every interval_s, writes atomically (tmp + rename)
      ▼
/var/lib/ntrip-monitor/<mountpoint>.json         ← a snapshot: this instant
/var/lib/ntrip-monitor/<mountpoint>.report.json  ← a report: the last hour
      │
      │  read at munin-node's poll (every 5 min)
      ▼
munin plugin `ntrip_monitor` ── prints multigraph config/values
A daemon, not a self-contained plugin, for a reason: munin-node invokes plugins for a few seconds every five minutes. Rates need a persistent connection, and dropouts — the thing a stream monitor most needs to catch — are invisible to a probe that connects briefly per poll.
The snapshot is single-line JSON in the project-wide statistics schema
(src/core/ns_stats.h, schema_version field). It is written to a
temporary file and rename()d into place, so a reader never sees a
half-written document. The same file is directly usable by anything
else: cat, jq, a cron job.
The snapshot gained selfpos_* keys — the station’s own position for
this epoch — without a schema_version bump, as the iono_* keys
did before them: consumers read by key, and nothing already published
changed meaning. One epoch’s offset is metre-level by construction and
measures nothing on its own; the figure worth watching is its scatter
over a window, which is in the report rather than here. selfpos_status
is 0 for solved and an SppStatus otherwise, and when it is not zero
every figure beside it is null — a single-frequency station cannot be
solved at all, and that is not an antenna standing still at its declared
coordinates. The same keys are appended to the CSV row, where an
unsolved epoch writes empty cells: a spreadsheet plots a blank as a gap
and a zero as a reading.
selfpos_rate_sign is worth an alert of its own. It is 1 when
the station’s phase-range rates follow RTCM 10403.3, 0 when it could
not be decided (four satellites or fewer with rates, or no velocity),
and -1 when the station’s receiver encodes them reversed — every
satellite the negative of what its orbit predicts. The velocity shown
is corrected for it, but the station is still sending a reversed field
to every rover that trusts it. At least one receiver in service does
this.
The two documents answer different questions
The snapshot says what is true now — bytes a second, satellites this
moment, whether the socket is up. The report says whether the station has
been fit, over a window of hours, in the vocabulary of tier 2:
STABLE, DEGRADED, UNSTABLE, INSUFFICIENT EVIDENCE. A station can
be perfectly healthy this second and have been unstable all week; those
are not contradictions, and giving them one file and one vocabulary would
make them look like one.
The report’s windows are measured in stream time, which is what lets a
replay reproduce a live run — and means that a stopped stream freezes the
window rather than shortening it. After stale_s (120 s by default) with
no movement of the stream clock, overall_name reverts to INSUFFICIENT
EVIDENCE and the headline says how long it has been, rather than
standing behind a window that ended. Watch for that as well as for
DEGRADED: a station whose report stops changing is a station that has
stopped.
{"report_schema_version":3,"mountpoint":"HANESE","window_s":3600.000,
 "samples":3598,"overall":1,"overall_name":"STABLE",
 "headline":"STABLE over 1.0 h","integrity_verdict":1,...,
 "selfpos_samples":3410,"selfpos_status":0,"selfpos_status_name":"solved",
 "selfpos_mean_e_m":1.842,"selfpos_scatter_m":0.934,...}
The version key is report_schema_version, not schema_version, and the
difference is deliberate: the Munin plugin finds snapshots by globbing
*.json and keeping whatever carries a schema_version. Under that name
a report would look like a snapshot to any plugin older than it — a
phantom graph family per station, full of undefined values, on every host
where the daemon is updated before the plugin.
Flat, single-line, one key per figure — the same shape the shell plugin
already reads, so nothing needs a JSON parser. Every metric contributes
<name>_verdict (0 insufficient, 1 stable, 2 degraded, 3 unstable),
<name>_value and <name>_detail. A metric that cannot be measured
emits null rather than a zero, so a graph cannot draw “not applicable”
as “fine”.
Version 2 added the selfpos_* keys, and they are the one group with
no _verdict: the station’s own position is reported as figures because
no threshold for its scatter has been established from evidence yet, and
inventing one would be worse than reporting none. selfpos_samples is
how many epochs solved; when it is zero every figure beside it is null
and selfpos_status_name says why — most often a single-frequency
station, where the measurement is not computable at all. The addition is
purely additive, so a reader written against version 1 keeps working; the
bump exists so that a document without these keys can be told from one
whose station solved nothing. selfpos_mean_*_m is an offset from the
reference position, mostly the solution’s own bias, and must not be read
as an accuracy; selfpos_scatter_m is the part that measures something.
Version 3 replaced selfpos_speed_max_mms with
selfpos_speed_median_mms, and this one is not additive: a reader
written against version 2 that looks for the old key will find nothing,
and should treat a version-3 document accordingly rather than as a
station with no velocity. The median replaced the maximum because a
single-epoch velocity from broadcast orbits is noisy — the maximum over
a window settled at 15–80 mm/s on bases bolted to pillars, decided by the
single noisiest epoch — while the median sits steadily in the low tens of
mm/s and is what a standing base can be judged against. It is read from a
1 mm/s histogram capped at 2 m/s, so it costs the daemon fixed memory per
accumulator however long the window.
The window rolls, and it is measured in stream time. The report
covers between one and two report_window_s — the daemon keeps two
staggered accumulators and always publishes the older, so the figure
never goes blank at a boundary. A session-scoped window would be
worthless here: this daemon runs for months, and “the worst CRC rate
since March” is not a thing anyone can act on. Stream time rather than
wall time means a station that goes silent stops advancing its own
window, instead of accumulating an hour of silence as an hour of health.
Building
On the target machine (needs build-essential):
make -C service
The Makefile compiles the daemon against the same src/core/,
src/net/ and src/session/ sources as the CLI and GUI, so all
artefacts report the same version (ntrip-monitord --version).
Installing
cd service
sudo make install
This installs, in order:
| What | Where |
|---|---|
ntrip-monitord |
/usr/local/sbin/ |
| systemd unit | /etc/systemd/system/ntrip-monitord.service |
| Munin plugin | /usr/local/share/munin/plugins/ntrip_monitor |
| Example config | /etc/ntrip-monitord/monitord.example.json |
| sysusers fragment | /usr/lib/sysusers.d/ntrip-monitord.conf |
| State directory | /var/lib/ntrip-monitor/ |
and runs systemd-sysusers, which creates the ntrip-monitor system
account the unit runs as.
Why a static account and not DynamicUser=: deployment proved
DynamicUser wrong for this service. systemd relocates a dynamic user’s
state directory under /var/lib/private/, which is root-only — and the
entire point of the state directory is that the munin user reads it.
The unit therefore uses User=ntrip-monitor with
StateDirectoryMode=0755 and UMask=0022, so snapshots come out
world-readable whatever the ambient umask.
Configuring
sudo cp /etc/ntrip-monitord/monitord.example.json /etc/ntrip-monitord/monitord.json
sudo chown root:ntrip-monitor /etc/ntrip-monitord/monitord.json
sudo chmod 640 /etc/ntrip-monitord/monitord.json
sudo nano /etc/ntrip-monitord/monitord.json
The chown/chmod matter: the config holds caster passwords, so it
should be readable by the service group and nobody else.
{
  "output_dir": "/var/lib/ntrip-monitor",
  "interval_s": 10,
  "mountpoints": [
    {
      "caster": "caster.example.net",
      "port": 2101,
      "mountpoint": "EXAMPLE1",
      "username": "user",
      "password": "password",
      "tls": false,
      "send_gga": false,
      "latitude": 52.0,
      "longitude": 6.0,
      "stall_timeout_s": 60,
      "eph_caster": "ntrip.kadaster.nl",
      "eph_port": 2101,
      "eph_mountpoint": "BCEP00KAD0",
      "eph_username": "user",
      "eph_password": "password",
      "eph_tls": false
    }
  ]
}
output_dirmust match the Munin plugin’senv.statedir(both default to/var/lib/ntrip-monitor).thresholdsjudges by a policy of your own rather than the built-in values — either a path to a JSON policy file, or the policy inline as an object. The daemon refuses to start if it cannot be applied, naming the field at fault: an operator who asked for a standard must get it or be told why, rather than have months of graphs published against something else. Every report then carries the policy name and a fingerprint over the effective values, and the startup line says the same. See thresholds.md.report_window_sis the tier-2 rolling window, 3600 by default; the published report covers between one and two of them. Values below 600 are ignored, because 600 seconds is the least evidence the report will judge on at all and a shorter setting could only ever publishINSUFFICIENT EVIDENCE.tls: truespeaks TLS to that caster. An explicit choice, never inferred from the port, and the certificate is always verified against the embedded Mozilla roots — a failed handshake or a wrong certificate is a classified failure, not a silent retry loop.send_gga: trueenables a periodic GGA uplink at the configured position — required by VRS / network mountpoints, harmless elsewhere.stall_timeout_sis how long a connected but silent socket is tolerated before the stream counts as dead and the daemon reconnects; 60 seconds by default,0waits forever. A caster can stop sending without closing anything, and nothing else in the daemon notices: the socket stays established and every published status keeps saying the stream is fine. Raise it for a mountpoint that broadcasts only occasionally; a 1 Hz observation stream that sends nothing for a minute has stopped.eph_caster,eph_port,eph_mountpoint,eph_username,eph_password,eph_tlsname an ephemeris side-stream for that station — a mountpoint carrying broadcast orbits (RTCM 1019/1020/ 1041/1042/1044/1045/1046), such as Kadaster’sBCEP00KAD0. The self-position figures need orbits, and a station that sends only observations — MSM7 and nothing else is common — reportsobservations without orbitsuntil it has some. A station that broadcasts its own needs no block: they are decoded from its stream.eph_portdefaults to 2101 andeph_tlsto false, as for the station.- Side-streams are shared. Orbits go into one cache for the whole
process, so entries naming the same source — same caster (compared
without regard to case), port, mountpoint, username and
eph_tls— open one connection between them, not one each. The startup log says how many stations each side-stream serves. Two entries that share a source but disagree oneph_passworduse the first, and the log says so. - A side-stream is infrastructure, not a station: it publishes no
snapshot and no report, reconnects with the same backoff, and logs
under an
[EPH caster:port/mountpoint]tag — including one line when the first orbit arrives after each connect, because a side-stream that is accepted but carries nothing would otherwise leave every station it serves unsolved without a trace. - Up to 16 mountpoints; the daemon round-robins them, and their side-streams, on one thread.
This is deliberately not the interactive tools’ config.json: that
schema describes one connection, a monitor needs a list.
Running
sudo systemctl daemon-reload
sudo systemctl enable --now ntrip-monitord
journalctl -u ntrip-monitord -f      # logs go to stderr → journald
ls -la /var/lib/ntrip-monitor/       # one <mountpoint>.json per stream
The daemon reconnects with exponential backoff (5 s doubling to 60 s) when a caster drops, and counts every reconnect in the snapshot.
For testing without systemd, --oneshot connects, waits a settling
window, publishes one snapshot per mountpoint and exits:
ntrip-monitord --config test.json --oneshot
Wiring up Munin
sudo ln -s /usr/local/share/munin/plugins/ntrip_monitor /etc/munin/plugins/
sudo systemctl restart munin-node
Graphs appear under the ntrip category after two master poll cycles (about ten minutes). Seven graph families per mountpoint:
| Graph | Shows | Alert defaults |
|---|---|---|
| throughput | bytes/s | — |
| integrity | CRC errors and framing re-syncs (rates) | warning on any CRC error |
| satellites | satellites tracked | — |
| cnr | mean C/N0 | warning below 35 dB-Hz |
| iono | median and worst-satellite ROTI | — |
| availability | connected (0/1), reconnects | critical when not connected |
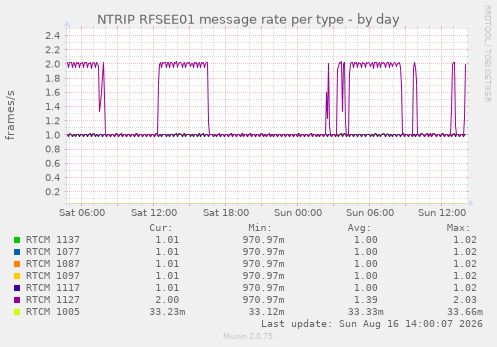
| msgrate | frames/s per RTCM type | — |
What they look like
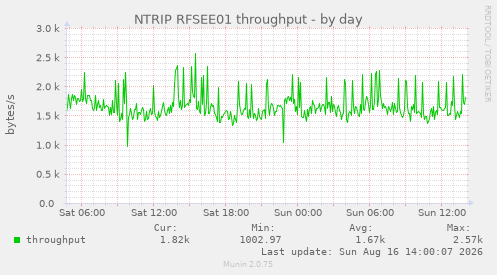
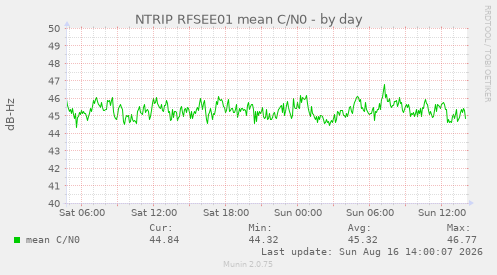
A day of RFSEE01, a six-constellation MSM7 station on a domestic
connection. These are the graphs as Munin draws them — the point of the
daemon is that these exist at all for a stream, which no NTRIP tool
otherwise gives you.
 |
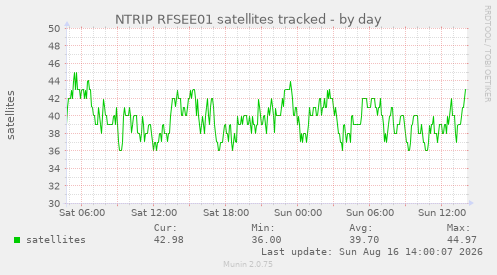 |
| Throughput. Flat is healthy. The first thing to move when a station degrades, and the easiest to attribute. | Satellites tracked. Currently in view, not seen this session — so the daily rise and fall is the constellation, while a slow decline over weeks is the horizon changing. |
 |
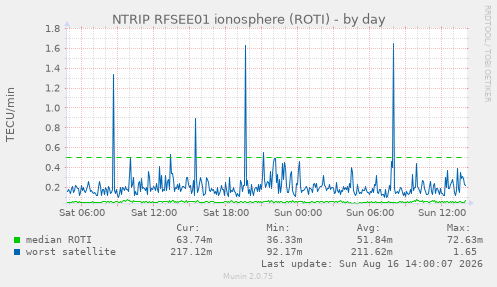 |
| Mean C/N0. The antenna and LNA chain, which ages. A step down overnight is rain in a connector far more often than it is the receiver. | Ionosphere (ROTI). Median and worst satellite. The one cause of poor RTK that is nobody's fault and needs proving. |
 |
|
| Message rate per type. A station that silently stops sending 1005, or halves its MSM rate, shows up here and nowhere else. | |
An eighth family, stability, draws the six tier-2 verdicts — availability, frame integrity, signal level, satellites held, ionosphere and delivery rate — on one 0–3 scale: 0 insufficient evidence, 1 stable, 2 degraded, 3 unstable. It is the only graph here that describes a window of hours rather than an instant, and it reads differently for it: a flat line at 1 is a station that has been fit for as long as the window is long, and a step to 2 says which of the six moved.
Degraded warns and unstable is critical, so Munin will alert on them.
Insufficient evidence never alerts — it is the honest state for the
first ten minutes after a restart, and a monitor that pages every time
the daemon is upgraded is a monitor people turn off. A metric that
cannot be measured on a given stream reads U rather than 0, so “not
applicable” is never drawn as “fine”.
The family appears only when the daemon is new enough to publish reports, so upgrading the plugin ahead of the daemon changes nothing and breaks nothing.
The remaining two families — integrity and availability — are flat lines on a healthy station and are worth looking at only when something is wrong, which is exactly when their alert defaults fire.
Plugin configuration, if the defaults need changing
(/etc/munin/plugin-conf.d/ntrip):
[ntrip_monitor]
env.statedir /var/lib/ntrip-monitor
env.stale    120
Staleness is a feature
A snapshot older than env.stale seconds (default 120) is reported as
U — undefined — for every field. Reporting the last known values
instead would draw a flat, healthy-looking line while the daemon is
down, which is precisely the wrong failure mode for a monitor. If all
your ntrip graphs go blank at once, check the daemon first:
systemctl status ntrip-monitord.
Two further behaviours worth knowing:
- The plugin ignores JSON files without a
schema_versionfield, so a stray file in the state directory cannot invent a graph family. - Munin field names are a frozen contract. Munin has no version negotiation; renaming a field silently starts a new RRD and orphans the history.
Satellites and C/N0
sats_total and cnr_mean report the satellites observed within the
last five seconds and their mean C/N0, tracked in the session layer so
the daemon, the GUI and Android all count the same way.
Two things worth knowing when reading those graphs:
- The count is “currently in view”, not “seen this session”. A satellite that sets drops out of the count. That is what makes the graph useful as a health signal: a base losing sky view shows a falling line rather than a permanently rising one.
- C/N0 needs MSM7. MSM4/5/6 carry no extended C/N0 field, so a base
transmitting only those reports satellite counts with
cnr_meanat zero. That is the stream’s doing, not the daemon’s. If you need the signal graph, configure the base to send MSM7 (1077/1087/1097/1127).
Verifying the chain
Each stage can be checked independently, from producer to consumer:
systemctl is-active ntrip-monitord                    # daemon up?
ls -l --time-style=full-iso /var/lib/ntrip-monitor/   # snapshot fresh?
cat /var/lib/ntrip-monitor/<MP>.json | jq .connected  # content sane?
sudo munin-run ntrip_monitor                          # plugin output?
rrdtool lastupdate /var/lib/munin/*/[host]-ntrip_throughput_*-g.rrd
A graph that “does not update” usually turns out to be a zoom window far wider than the data: RRDs created twenty minutes ago render as a sliver at the right edge of a 30-hour view.
Troubleshooting
| Symptom | Likely cause |
|---|---|
| Snapshots exist but Munin shows nothing | Plugin not symlinked, or env.statedir mismatch |
All graphs blank (U) |
Daemon stopped — the staleness guard is doing its job |
connected is 0, reconnects climbing |
Caster unreachable or credentials rejected; see journalctl -u ntrip-monitord |
Snapshots under /var/lib/private/ |
The unit was started with an old DynamicUser= version; reinstall the unit, systemctl daemon-reload, remove the stale directories, restart |
Plugin works via munin-run but not in graphs |
munin master not polling this node; check /var/log/munin/munin-update.log |
See also
- Documentation index
design/architecture.md§5 — why the daemon+plugin shape was chosensrc/core/ns_stats.h— the snapshot schema the JSON follows